
Food labels are designed to help us make safer and healthier food choices, but they’re not always easy to understand. From supermarkets and online food stores to cafés and restaurants, nutrition information is now more widely available than ever. Between nutrition tables, health claims, ingredient lists and colourful packaging, it’s easy to focus on the marketing rather than the facts.
Learning how to read food labels can help you compare products, manage allergies and make more informed decisions about the food you buy. Although UK food labelling is tightly regulated, clever marketing can still paint a misleading picture.
So, let’s look at the main areas:
Food Safety
This is all about keeping us safe. The main confusion is often about the dates put on labels.
Use By: This is the date that relates to safety. Foods shouldn’t be eaten after this date, especially if chilled or ready-to-eat foods,
Best Before: This is about quality rather than safety. The key point here is that foods may still be safe to eat after this date if stored correctly, though taste, texture, and appearance may change.
Storage Instructions: Phrases like “Refrigerate below 5°C” or “Consume within 2 days of opening” are essential for preventing foodborne illness.
Allergen Information
After several tragic and high-profile cases in recent years, allergens have become a high priority. You may have noticed at some cafes you are asked if you have any allergies before your order is even taken. UK law requires 14 major allergens to be clearly declared and emphasised in ingredient lists (often in bold, coloured or capital letters).
The 14 regulated allergens are:
- Celery
- Cereals containing gluten (such as wheat, barley and rye)
- Crustaceans
- Eggs
- Fish
- Lupin
- Milk
- Molluscs
- Mustard
- Nuts
- Peanuts
- Sesame seeds
- Soybeans
- Sulphur dioxide and sulphites.
Allergens may also appear in separate “Contains” statements. Advisory warnings such as “May contain nuts” indicate possible cross-contamination and should be taken seriously.
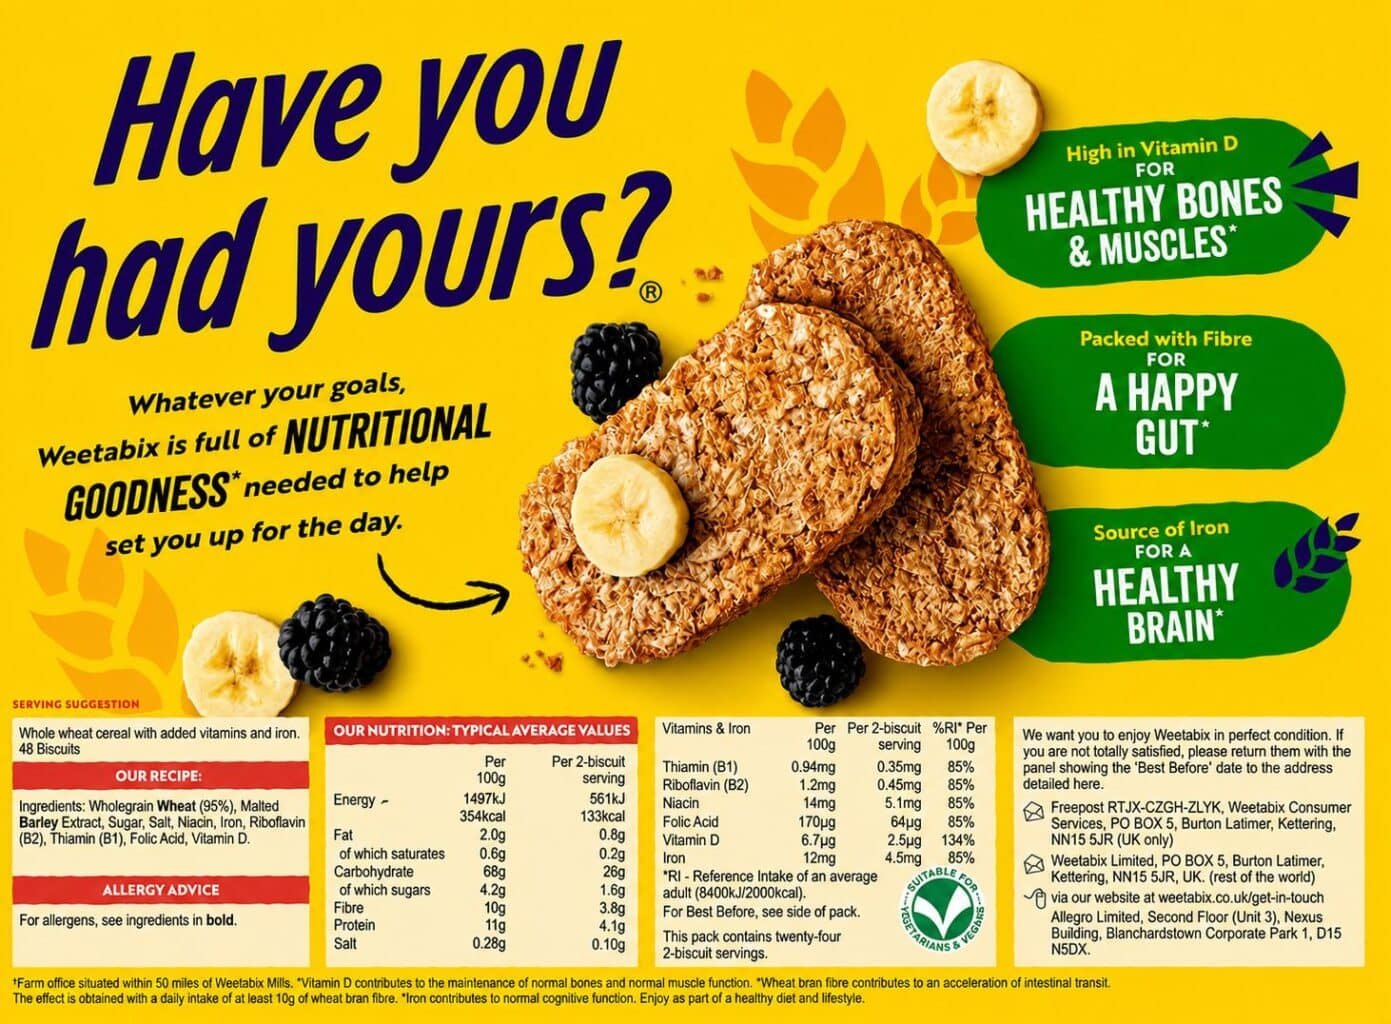
Ingredient List
This tells us what the product is made of. Ingredients must be listed in descending order by weight, which means the ingredient used in the largest amount appears first. So the first three ingredients often give a good indication of what the product is mostly made from.
Highly processed foods often contain longer ingredient lists, additives, flavourings, emulsifiers or sweeteners. However, processing alone doesn’t determine whether a food is healthy or unhealthy, so it’s important to consider the overall nutritional value rather than relying on labels such as “ultra-processed (UPF).”
For example, some shop-bought hummus could be classed as a UPF as they contain preservatives or stabilisers, which are added to extend shelf life. Despite this, hummus is still a good source of protein, fibre and unsaturated fats, demonstrating why it’s important to consider the overall nutritional value of a food rather than focusing solely on its level of processing.
A few key things to watch for:
- Sugar can appear under multiple names (e.g. glucose syrup, fructose, malt extract), which can make sugar appear less prominent.
- Additives and E-numbers, many of them are likely to indicate more processing.
Quantitative Ingredient Declaration (QUID)
In certain circumstances, it’s necessary to state on the label the quantity, in percentage terms, of an ingredient. This usually happens when the ingredient is in the name of the food or shown prominently on the packaging. For example, a “strawberry yogurt” will need to state what percentage of strawberries it contains, and a “ham & mushroom pizza” will state the percentage of ham and mushroom.
Nutrition Information
UK food labels must display nutrition information per 100g or 100ml, and often per serving. Always compare products using the values per 100g or 100ml. Manufacturers choose the serving size themselves, and some portions may be unrealistically small, making products appear healthier than they really are.
Many labels also display the percentage of your daily Reference Intake (RI). This shows roughly how much a serving contributes towards an average adult’s recommended daily intake for calories, fat, saturates, sugar and salt. These values are based on average requirements and may not reflect your own needs.
Key nutrients to check:
- Energy (KJ and kcal)
- Fat and saturated fat
- Carbohydrates and sugars
- Protein
- Fibre
- Salt
The total carbohydrate value includes starches, sugars and fibre. Looking at the sugar content and ingredient list provides a better indication of the type of carbohydrate you’re eating. The sugar value includes both naturally occurring sugars (such as those in milk and fruit) and free sugars. Looking at the ingredient list can help you identify whether sugars have been added during manufacturing.
The same is true for the total fat value, it only provides limited information. We really need to know the nature of the fat, which is where the saturated content can be helpful. Some products also list monounsaturated and polyunsaturated fats, which can provide additional information about the type of fat the food contains.
To make it more confusing, high saturates doesn’t always mean an unhealthy product, you have to think about the product itself. For example, foods such as cheese, yoghurt and nuts naturally contain some saturated fat but also provide protein, vitamins and minerals. Looking at the whole food is often more useful than focusing on a single nutrient.
Large restaurants, cafes and takeaways in England are required to display calorie information on menus. This can help people compare options, although calories are only one aspect of a healthy diet and don’t reflect nutrient quality.
Traffic Light Labelling
This was voluntarily adopted by some manufacturers from 2006, and was officially introduced by the Department of Health in 2013. However, traffic light labelling is not mandatory.
Many foods now in the UK use traffic light labels to show whether; fat, saturated fat, sugar and salt levels are; low, medium or high.
- Green – Low
- Amber – Medium
- Red – High
Traffic light labels are useful for comparing similar products, but they don’t tell the whole story. Foods with mostly green labels can still be high in calories or highly processed, while naturally nutritious foods such as cheese or nuts may receive amber or red ratings because of their fat or salt content.
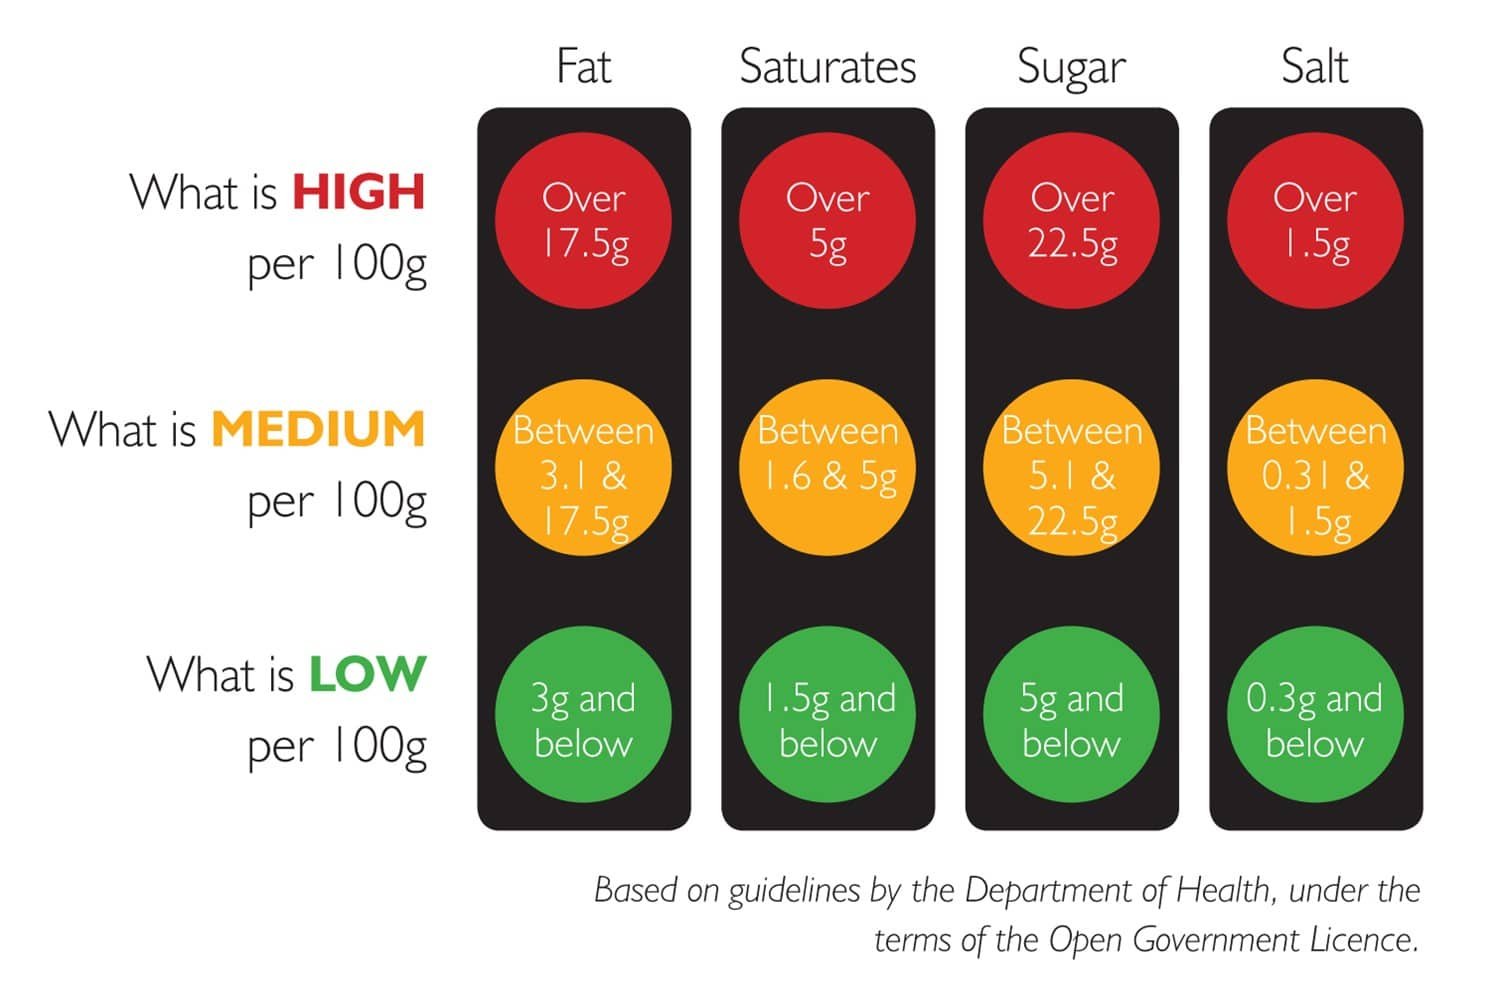
The ranges for each colour are also quite broad, particularly for Amber. For example, a food containing 4g of fat per 100g and another containing 17g per 100g would both receive an amber rating, despite there being a substantial nutritional difference between them.
Nutrition and Health Claims
There was once a time when it was permitted to make a wide range of dubious health claims on products. You may recall the UK slogan by Mars bar manufacturers ‘A Mars a day helps you work, rest and play’.
Today, nutrition and health claims are tightly regulated, although they can still create a misleading impression by emphasising one positive feature while distracting from the overall nutritional quality of the product.
Common examples:
- “No added sugar” – cannot have sugars added during manufacture, but they may still be naturally high in sugars (for example, fruit juice or dried fruit).
- “Low Fat” – Fat is often replaced with sugar or refined carbohydrates.
- “Natural” – Not a legally defined nutrition claim in the UK
- “Source of calcium” – the product must have at least 15% of the reference intake (RI) per 100g.
Remember that claims tend to highlight one positive aspect and often distract from less healthy features.
How Food Packaging Influences Buying Decisions
Food packaging is designed to be noticed and sell the product, not to educate consumers.
Typical tactics include:
- Using smaller serving sizes to make negative nutrition values appear lower
- Splitting sugar into several ingredients so it appears further down the ingredient list
- Adding small amounts of vitamins and minerals to create a “health halo”
- Using buzzwords and phrases like wholesome, real, Lite, or guilt-free
- Showing images or descriptions of ingredients that are present only in tiny amounts
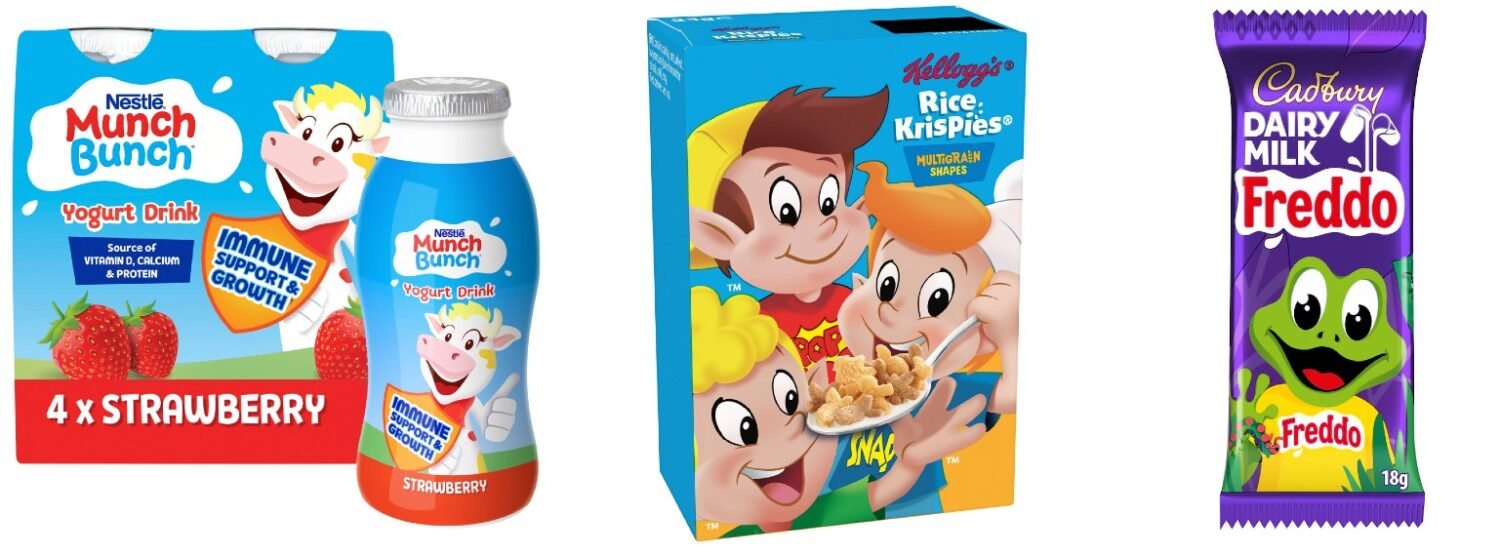
- Using popular images like cartoon characters or sports people to help sell less healthy products
- Using a well-known charity logo to suggest they are endorsing the product.
Key Takeaways
- Ignore the marketing on the front.
- Read the ingredients list first.
- Compare products using the nutrition values per 100g.
- Don’t rely on a single claim like “low fat” or “high protein”.
- Consider the food as a whole rather than one nutrient in isolation.
Remember, start small. You don’t need to obsessively check the label on the back of every item before adding it to your shopping basket. Pick one or two items each week. If you’re happy with the product, carry on. If not, try finding an alternative.
If it’s something that’s not so great for your health, but you really love, that’s ok. You don’t need to be perfect. Maybe, just try to reduce how frequently you eat that food.
Over time, you’ll become familiar with the foods you regularly purchase, making label reading much quicker. If you’d like extra support, apps such as Yuka can help interpret food labels by scanning barcodes, although they’re not perfect and shouldn’t replace your own judgement.
References:
Colombet, Z et al, ‘Effect of calorie labelling in the out-of-home food sector on adult obesity prevalence and cardiovascular mortality in England’, The Lancet Public Health (2024)